Analytical Paragraph Writing Class 10 updated for 2026-2027 exams
See Analytical Paragraph writing Format, Topics, Examples, Samples and Frequently Asked Questions (FAQ)
Are you facing a tough time solving the question on Analytical writing? You have our back on this.
An analytical paragraph is a form of descriptive writing which is written on the basis of a given chart, graph, data, outline, clues, table etc. When writing an analytical paragraph, one should remember to describe the facts in the best possible manner and to cover most of the information provided.
The analytical paragraph class 10 has to be written in around 100-120 words. So the paragraph must use clear and crisp language along with providing complete details of the chart given in the question. There will be an internal choice given. You will have a choice to attempt any one question out of the given two questions on analytical paragraph writing. The question carries 5 marks. Let’s delve in and check out the details related to analytical writing
- Analytical Paragraph Class 10 Video
- Analytical Paragraph class 10 Format
- Analytical Paragraph Writing Practice Test Download PDF
- Features of an Analytical Paragraph Writing
- How to Score 5/5 in Analytical Paragraph
- Analytical paragraph class 10 Marking scheme
- Useful tips for Writing an Analytical Paragraph
- Analytical Paragraph Infographic
- Analytical Paragraph Examples, samples
- Analytical Paragraph Doubts Session Video
- Analytical Paragraph writing Quiz
- Analytical Paragraph FAQs
Analytical Paragraph Class 10 Video
Related – Notice Writing, Format, Topics, Examples
Analytical Paragraph Class 10 Format
An analytical paragraph shall be divided into three parts-
- Introduction
- Body of the paragraph and;
- Conclusion
Related: 10 Examples of Analytical Paragraph
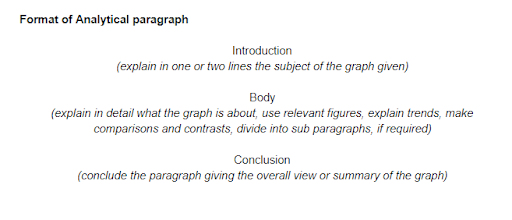
Format of Analytical paragraph writing
Related – Report Writing, Format, Topics, Examples
Let us discuss each of these in detail –
1. How Do You Start An Analytical Paragraph?
The introduction
The introduction is the first paragraph that should describe in brief what the graph is about. It should be like an opening paragraph that introduces the reader to the context of the chart given. When writing the introductory paragraph, you need not go into the details. You just need to mention what is clearly evident from the chart or the graph given in the question. It is best to write the introduction in one or two lines.
2. The body of the paragraph
This part of the analytical paragraph should contain details of the graph/chart given in the question. It should contain all the important information. It is extremely important to choose the significant details that should be included in the paragraph.
The body can be broken into two or three sub-paragraphs depending on the information extracted from the graph. Breaking the body into subparagraphs makes it easy for the reader to understand.
i. Organizing information: You should look for the large differences that are very prominent. You can mention the aspect which is the smallest or the largest in the data given. Any aspects that are similar should be mentioned next. You should further mention about the aspect that has remained unchanged or constant throughout.
ii. Comparing information: If the chart mentions two different parties, for example, men and women, refer to both of them in the analytical paragraph. If there is any contrast or comparison that could be drawn, you must present it effectively. If the chart is about a particular time period or highlights trends of several years, mention each year in a concise manner. If any comparison or contrast can be done for two or more years, you should write about it too.
iii. Mentioning quantities: When including numbers and figures, their accuracy must be ensured. There are a number of ways that can be used to describe quantities, for example- percentage, fraction, ratios, etc.
iv. Connecting sentences: If different information or ideas are there, you should use connectors or linking phrases to link them logically. The sentences of the paragraph should be sequential and connected rationally.
Related: 6 Common Mistakes in Analytical Paragraph Writing for Class 10
3. The conclusion
The last paragraph should summarise the idea mentioned and the information in general. It should be concluding in nature and act as the closing statement. One should keep in mind that one must not include any personal opinions, conclusions, or observations. You should simply stick to the facts.
You need not dispose of the information to write a good analytical paragraph. The key is to choose wisely the important information, organize it well, state correct facts and summarise it properly.
Analytical Paragraph Practice Test Download PDF
For practice test on Analytical Paragraph writing (with model answers), click here
Features of an Analytical Paragraph Writing-
- It describes the given chart, table, data, graph, cues etc.
- It should be brief and comprehensive (include complete information) at the same time.
- It should state facts that are provided by the chart.
- It is necessary to make use of simple and accurate language.
- It should mention figures and quantities appropriately.
- It is appropriate to use the same tense throughout the analytical paragraph.
- No personal observation or response should be provided.
- It would be preferable to use the passive form of the verb.
How to Score 5/5 in Analytical Paragraph
If you are curious to know what all should you do to score full marks in analytical paragraph writing, then read further-
- Do not confuse analytical writing with descriptive writing or summary writing.
- It requires examining the given elements closely and sharing inputs based on given stimulant.
- It carries no title or heading.
- Follow the format and distribute words intelligently.
- Repetition can be a deterrent so include a variety of observations.
- Remember to add phrases for describing trends and making comparisons.
- Please avoid losing marks on account of spelling mistakes and grammatical errors.
- Presentation matters. So, write neatly.
- Do not add any personal experiences or information that is not mentioned in the data provided.
- Adhere to the word limit to avoid wastage of time and a deduction of marks.
Analytical Paragraph Class 10 Marking Scheme
The question of Analytical paragraph writing carries a total weightage of 5 marks. Out of these 5 marks, Content carries 2 marks. Students should add four trends/ points as noticeable in the given data. Organisation of ideas carries another 2 marks for effective style, orderly sequence, single paragraph structure, formal tone and functional vocabulary. Accuracy carries 1 mark and covers spelling, punctuation and grammar.
| Analytical Paragraph writing Break up of marks | |
| Content | 2 |
| Organization of ideas | 2 |
| Accuracy | 1 |
| Total | 5 |
Related: Letter to Editor Format, Topics, Samples
Useful tips for Writing an Analytical Paragraph
- For an introduction, you can start with the following phrases-
- The chart given above describes
- The table suggests
- The line graph shows
- The data given provides information about
- The pie chart illustrates, etc.
- For describing trends, use phrases and words like- a pattern of growth, rapidly doubled, skyrocketed, striking increase, peaked, soaring rates, declined, plummeted, leveled off, stagnated, fluctuate, starting to rise, starting to fall, drop down, slightly, etc.
- For describing quantities, use various styles like- 48% of, one-third of, nearly one-fourth of, almost 80%, majority, on average, twice as much, almost equal, the highest, the lowest, very close to 2%, roughly, approximately 5% of, just under three percent, etc.
- For establishing a relationship or contrast, use phrases and words like- relationship between, similarly, in contrast with, in comparison to, but in the opposite case, however, whereas, when it comes to, as opposed to, while, striking difference, noticeable difference, etc.
- For the conclusion and other connecting phrases use- overall, subsequently, in all, in a nutshell, for the chart given, in short, striking changes, including, therefore, etc.
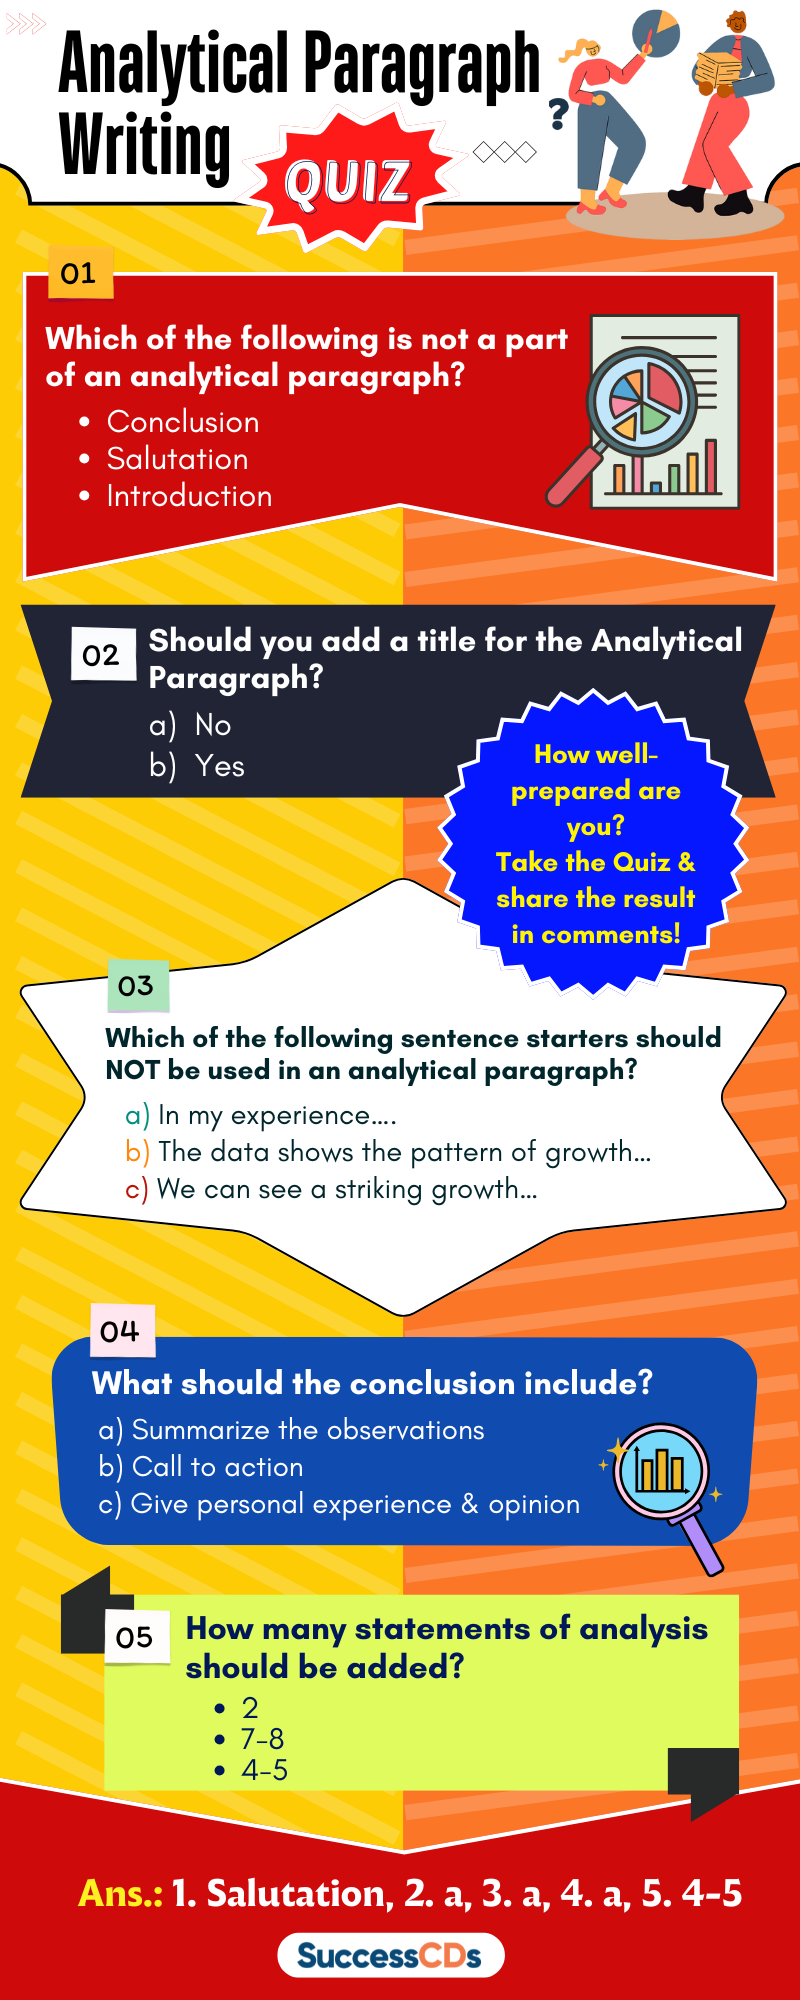
Analytical Paragraph Infographic

Analytical Paragraph Doubts Session Video
Class 10 Analytical Paragraph Examples, Samples
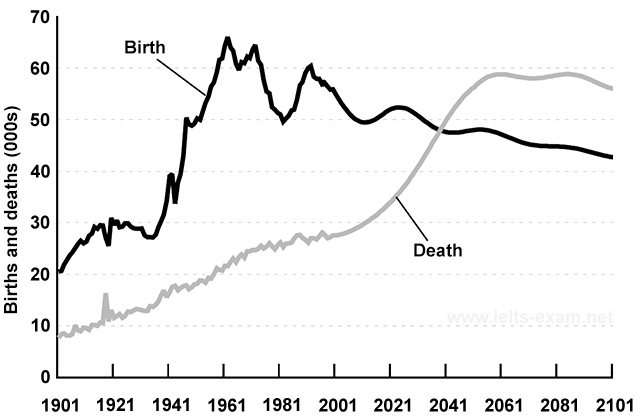
Example Question 1: Below is a graph given showing birth and death rates in a country from 1901 to 2101. Write an analytical paragraph (100-150 words).
Answer 1:
The graph shows birth and death rates starting from 1901 till 2101.
Since 1901, the birth rate has remained more than the death rate until 2041. Birth rate was 20000 in 1901 and started increasing gradually. It peaked in 1961 to around 65000. From 1961, birth rate has fluctuated multiple times between 50000 and 60000. It is expected to decline for the coming years reaching approximately 42000 by 2101.
On the other hand, the death rate stood at around 10000 in 1901 and then has increased steadily. It is expected to rise strikingly from 2021 before levelling off to approximately 60000 between 2061 and 2081. The graph indicates a slight decline in deaths in the year 2101.
The graph shows the huge gap between birth rate and death during 1961 to 2001. However, this gap is expected to reduce in the later years. Overall, as opposed to the prevailing trends, the death rate will be more than the birth rate in the later half of the 21st century.
Related: Formal Letter writing in English Topics, Types, Examples
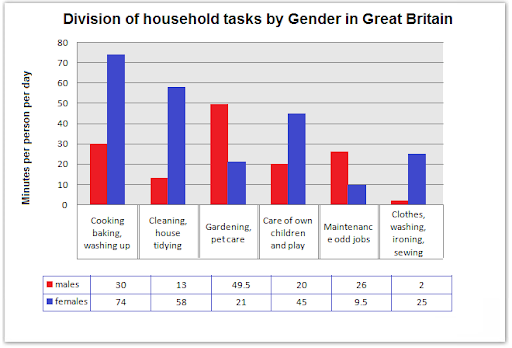
Example Question 2: The chart shows the division of household tasks by gender in Great Britain. Write an analytical paragraph describing the chart given in not more than 200 words.
Answer 2:
The chart shows the number of minutes per day spent by British men and women in doing household tasks. On an average, the women spend about four hours doing household tasks whereas the men spend less than two and half hours.
The tasks on which women spend more time than men include cooking, cleaning house, taking care of the children and laundry. In doing all these tasks, women spend approximately 200 minutes which is almost three times the time spent by men in these tasks. On the other hand, men spend twice the time than women in doing tasks like gardening and maintenance of odd jobs in the house. Men spend the highest time, almost 50 minutes, in gardening and petcare. While the women spend only 30 minutes for these tasks. The time spent by men in washing, ironing and sewing clothes is as low as 2 minutes per day as opposed to 25 minutes spent by women.
In short, women spend far more time doing household chores than men whilst men prefer to do gardening, petcare and maintaining odd jobs.
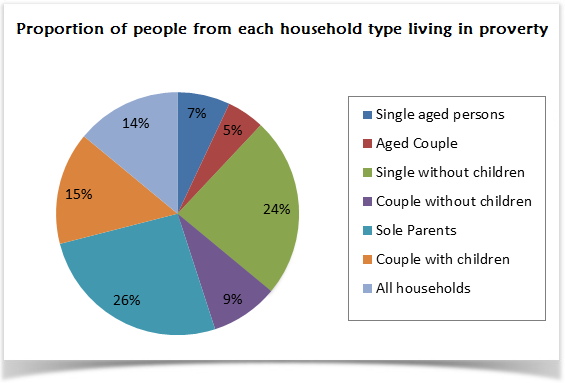
Example Question 3: The pie chart shows the proportion of people from different households living in poverty in the UK in 2002. Write an analytical paragraph to describe the information in 100-120 words.
Answer 3:
The given pie chart illustrates seven different categories of households living in poverty in the UK in 2002.
It is clearly evident from the pie chart that 26% of the total poverty-stricken households are those of sole parents. Single people without children account for the second highest proportion with 24%. In contrast to couples without children that accounts for just 9%, couples with children account for 15% of the poor households. Single aged persons and aged couples proportion for 12% together for poor households.
Overall, 14% of all households in the UK were living under poverty. The younger generation had a greater poor percentage than their aged counterparts. Couples without children had better economic conditions than those with children.
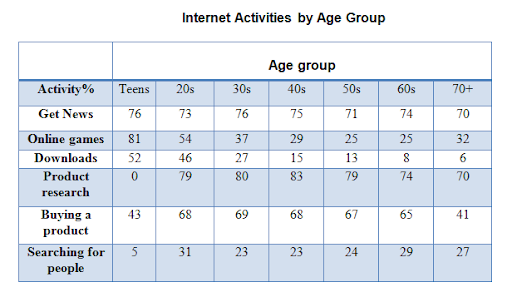
Example Question 4: The following table shows details about the internet activities for six categories for different age groups. Write an analytical paragraph for the table given in around 150-200 words.
Answer 4:
The given table suggests the internet activities of seven age groups ranging from teens to those in their seventies for six different kinds of activities. The table shows that the younger generation is more interested in online games and news, while the older generation spends time on the internet to research and buy products.
It is evident from the table that teens mainly use the internet for games (as high as 81%), news and downloads and are interested in searching for people or friends or doing any product research. The middle-age group (people in 20s to 60s) is highly interested in getting news, doing product research and buying products, the percentage ranging from 70-80%. The internet activity which gets the least time is searching for people. All the age groups spend less than 30% of their internet time on the same. The amount of time spent on downloads decreases with age and gets as low as 6% (for people in 70s).
Overall, the table suggests that teenagers are most likely to spend time playing games and doing downloads. On the other side, older people are interested in researching and buying products. People spend the least amount of time searching for other people online.
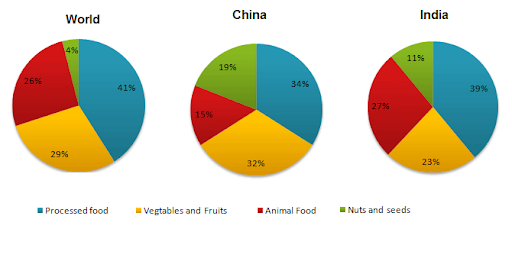
Question 5: Below given are three pie charts showing consumption habits of India, China and World overall in 2008. Write an analytical paragraph describing the pie charts (100-120 words).
Answer 5:
The three given pie charts depicts types of food consumption in 2008 as compared in two countries- India and China. In general, processed food is the major type of food eaten.
Processed food comprises as high as 41% of the global consumption. In China and India as well, processed foods are consumed the most, the rate of consumption being 34% and 39% respectively. On an average, vegetables and fruits constitute 29% of consumption. In China, vegetables and fruits comprise 32% of food consumption which is 9% more than that of India. For Indians, animal food accounts for 27% of their diet, exceeding Chinese food consumption by a striking 12%. However, nuts and seeds comprise almost one-fifth of Chinese food habits. This is way more than the global consumption of 4% and 11% of India.
Overall, world food consumption largely comprises processed food. Chinese consumption of nuts and seeds is unbelievably higher than the average percentage.
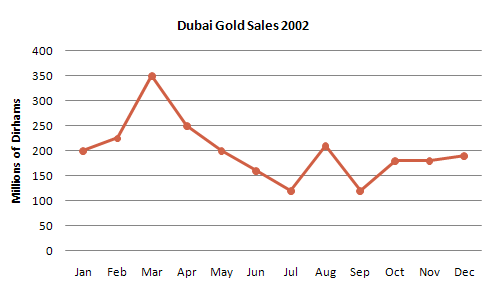
Question 6: The graph given shows estimated sales of gold in Dubai in 2002. Write an analytical paragraph describing the line graph in around 150 words.
Answer 6:
The line graph depicts the estimated sales of gold in Dubai for a period of twelve months in 2002 in millions of Dirhams.
In January 2002, the sales stood at 200 million Dirhams. It steadily increased through the next month and peaked to 350 million Dirhams in the third month of the year. However, the gold sales started to plummet over the next three months and hit 110 million Dirhams in the month of July. Unexpectedly, the sales doubled in August before coming down to the same level as in July for the month of September. For the next two months of the year, the gold sales levelled off to 180 million Dirhams and then slightly increased in December.
Overall, the estimated gold sales fluctuated in 2002. The sales were the highest in the month of March and lowest in the months of July and September. The sales at the end of the year were almost the same as they were in the beginning of the year.
Analytical Paragraph Writing Quiz
Analytical Paragraph Class 10 FAQs
Q1. Define an analytical paragraph.
Ans. An analytical paragraph is a type of descriptive writing piece in which one presents information from pie and bar graphs, charts, tables, and other types of analytical data in the form of a paragraph.
Q2. What are the key characteristics of an analytical paragraph?
Ans. The key characteristics of an analytical paragraph are as follows:
1. It conceptualizes the information given in graphs, tables, and charts.
2. It should contain only the analytical information – nothing more or less.
3. The information in the paragraph should match the given information.
4. The language need not be complex.
5. The same tense is preferred throughout the analytical paragraph.
6. The paragraph should not have the personal opinion or observation of the writer.
Q3. Describe briefly the different types of analytical paragraphs.
Ans. The different types of analytical paragraphs that can be asked in the examination are as follows:
a) Data-orientated – In this, students need to analyze and understand the information given in charts, tables, and graphs. This is the most common type of analytical paragraph.
b) Information-orientated – In this, students need to analyse information given in a short paragraph along with some analytic data like charts, graphs, and tables.
c) Process-description-orientated – In this, students need to analyze information given in flowcharts, diagrams, and infographics and convert it into a brief paragraph.
Q4. What is the format of an analytical paragraph?
Ans. An analytical paragraph has three sections – Introduction, body, and conclusion.
Introduction
—————————————
————————————–
Body
—————————————-
—————————————-
—————————————
Conclusion
—————————————-
—————————————-
Q5. What should the introduction of an analytical paragraph contain?
Ans. The introduction of an analytical paragraph contains the subject of the analytical paragraph and its purpose. It can be written in just one or two lines.
Q6. What should the body of an analytical paragraph contain?
Ans. The body of an analytical paragraph contains the necessary details of the given data. It explains trends, compares two aspects or objects, and establishes a relationship between them. It gives the same facts as in the question in a descriptive and analytical manner.
Q7. What should the conclusion of an analytical paragraph contain?
Ans. The conclusion of an analytical paragraph, as the name suggests, concludes the paragraph by giving an overall statement about the given data. We can use phrases like – overall, in all, in a nutshell, in short, therefore, etc. Be careful not to give any personal observations or opinions.
Q8. Mention what phrases one can use to describe trends in analytical paragraphs.
Ans. One can use these phrases and words to describe trends in an analytical paragraph:
– A pattern of growth/decline
– Skyrocketed
– Stagnated
– Fluctuate
– Levelled off
– Plummeted
– Peaked
Q9. Mention what phrases one can use to describe quantities in analytical paragraphs.
Ans. One can use these phrases and words to describe quantities in an analytical paragraph:
– One-third of
– Majority of/minority of
– Twice/thrice
– Highest/lowest
– Very close to/just under 2%
– Roughly/approximately
Q10. Mention what phrases one can use to establish a relationship or comparison between two trends or quantities in analytical paragraphs.
Ans. One can use these phrases and words to establish relationships or compare two trends or quantities in an analytical paragraph:
– Similarly
– In contrast with
– In comparison to
– But in the opposite case,
– However
– Whereas
– Stricking/noticeable difference
Conclusion
Students of class 10 can get acquainted with the topic details of analytical paragraph writing. This post will help the students to prepare analytical writing for the 2026 board exams. Check out the format, marking scheme, tips and examples of analytical paragraph writing.
Recommended Read
Class 10 English (Language and Literature)
Also, see
Please feel Free to ask any questions on the topic of Analytical Paragraph Writing for class 10. If you wish to check out the examples visit https://www.successcds.net/learn-english/writing-skills/10-examples-of-analytical-paragraph
Also, don’t miss out all other topics on Writing Skills for students. Follow this link here https://www.successcds.net/learn-english/writing-skills
hey bro, did you do someting?
Very useful
hey, its my dream can you add my name in the informal letter section its my dream
add my name Hrishabh
please also add the link so that i can see it please do it