CBSE Class 10 English Analytical Paragraph Writing Questions (with model answers) from previous years question papers
Analytical Paragraph Writing Previous Year Questions with answers – Do you find writing analytical paragraphs stressful? Then check out the below-mentioned previous year questions on analytical writing. The model answers will enable you to get a grasp over the topic and understand the nitty-gritties of the topic.
Related:
- Letter to Police Previous Year Questions
- Letter to the Government Previous Year Questions
- Order Letter Writing Previous Year Questions
- Complaint Letter Previous Year Questions
- Letter to Editor Previous year Questions
- Analytical Paragraph Writing Format, Tips, Samples
- 10 Examples of Analytical Paragraph Writing
Previous Year’s Class 10 English ‘Analytical Paragraph Writing’ Questions
Q1. Today, many projects in India are being initiated and implemented with the aim of transforming India into a digitally empowered society and economy. [CBSE 2025]
- Digital India Program
- IT-Jobs
- E-governance
- E-Kranti Electronic Delivery of Services
- Broadband for all – Urban and Rural
- Information for all.
Write an analytical paragraph of 100-120 words based on the given information.
Ans. The government has launched various digital initiatives to boost our economy and empower the society. It has led to various government schemes and a rise in IT related jobs. Initiatives like E-governance, E-Kranti Electronic Delivery of Services, Broadband for all and Information for all have transformed our working. All these government schemes ensure that the new generation are well-versed with the digital economy, and that everyone can access digital platforms to make government processes more smooth and convenient. This has significantly bridged the rural-urban divide.
The programme has not yet ended as there are still many challenges being faced due to overpopulation and the slow paced development of the country. But with one step at a time, the nation is becoming more and more empowered in a digital manner and soon, India will go from being second place to first place on the basis of digital adoption.
Q2. Read the given details of the different activities that interest children in the age group of 14-17 years. [CBSE 2025]
- dance, music, art
- outdoor sports like cricket, hockey, basketball, soccer, tennis
- computer games
- net surfing
- social media
Analyse the details and write an analytical paragraph in about 120 words about the suitability of the given activities. Focus on factors like interest, physical, mental and emotional development, personality development, and suitability.
Ans. The information provided to us gives us a view of how children or teenagers of ages 14 to 17 tend to spend their free time.
Children of ages 14 to 17 engage in mostly computer or digital based hobbies due to a more digitally influenced lifestyle. This includes playing games on computer and phone, posting images and socialising on social media, or even the simple act of scrolling on the phone, which is also called surfing. On the other hand, children are also engaging in artistic hobbies like music, dance and art. This boosts creativity but can be isolating and distracting from academic studies. In addition to social media, children now have access to more forms of art and learning new techniques, which is helping their brain to develop in a more creative and constructive manner. Children are also engaging in physical interests like playing games- which offer adequate and fun exercise for both the body and the brain.
With the right guidance, children can use their resources to channel their energy and endless curiosity in the correct direction while also excelling in their academic performance.
Q3.The effects of technology on education have been profound and multifaceted; influencing both teaching and learning in various ways. The data below shows the rising enrolment in online courses over the years. Analyze the data and write an analytical paragraph, in about 120 words, about how technology has transformed teaching and learning by shifting from classrooms to digital devices. Discuss benefits such as access to information and challenges like digital divide. [CBSE 2025]
| S. No. | Year | Total number of enrolments (in millions) |
| 1. | 2017 | 26 |
| 2. | 2018 | 43 |
| 3. | 2019 | 59 |
| 4. | 2020 | 76 |
| 5. | 2021 | 143 |
| 6. | 2022 | 189 |
Ans. The advent of technology in education is evident from a striking rise in enrolments for online education. Starting from 2017, we see a steady increase in the amount of enrollments in online education. The amount nearly doubles when going from 2017 to 2018 and from 2020 to 2021, and the latter can be explained by the pandemic that went on for 2 years from 2020 to 2022. In the year 2021, the amount of enrollments crossed 100 million and in 2022, it nearly reached 200 million.
Technology has made both teaching and learning easier and effortless. With various softwares and devices, education has become more profound and multifaceted. However, the challenge of digital divide is creating inequality towards accessibility to education which is a fundamental right and should be available to all. Thus, despite the numerous benefits, online education needs a better infrastructure to get stability in India.
Q4. Read the given details about the pros and cons of artificial intelligence (AI). With the help of the given cues and your own ideas write an analytical paragraph in about 120 words on “AI-Benefits and drawbacks”. [CBSE 2025]
- AI is possessed by machines
- Impacted our lives in many ways
- AI-Google maps
- Knowledge at our fingertips
- Cannot wholly replicate humans
- Increase in cyber crime
Ans. Artificial Intelligence (AI) has significantly impacted our lives in many ways, particularly by enhancing convenience and efficiency. AI-powered applications, such as Google Maps, have revolutionized navigation, providing real-time updates and directions, making travel more accessible and accurate. However, many incidents of mishaps due to incorrect navigation have a lso been reported. Additionally, AI has brought knowledge to our fingertips, allowing quick access to vast amounts of information but here also, it fails to provide authentic guidance which can act as a spoilsport.
Moreover, AI is still limited in its capabilities; it cannot wholly replicate human qualities like creativity, emotional understanding, or intuition. To add fuel to the fire, the rise of AI has led to an increase in cybercrimes, as criminals exploit AI systems to launch attacks, such as hacking or data theft. While AI offers immense benefits, its drawbacks must be carefully managed.
Q5. The visual given shows the life cycle of a butterfly. Study the information carefully and then summarise it in the form of an analytical paragraph. Make comparisons and draw conclusions wherever applicable. [CBSE 2024]
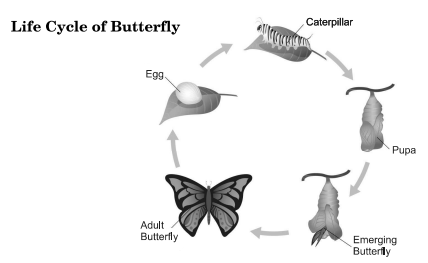
Ans. A butterfly starts its life cycle as an egg. The hatching of the egg depends on physical conditions, the most influential one being temperature. If it’s warm, the hatching process will be quick and efficient. The hatching of the egg gives way to the second stage of the life cycle – the larva. The larva, popularly known as the caterpillar, is the next stage where the creature eats the most in order to grow and shed its skin multiple times to develop into the subsequent stage of the life cycle. The shedding of skin is a process called moulting, and when it eats and grows to an appropriate level, it develops a protective and nutritive cocoon around its body, which is also known as chrysalis or pupa. This is the third stage in the life cycle, in which the caterpillar transforms into a butterfly. After some rest period, the cocoon breaks to give out the next and final stage in the butterfly’s life cycle- an adult butterfly. Unlike the earlier stages, this is the one and only stage where the butterfly has its renowned and beautiful wings.
In one month, the butterfly undergoes complete metamorphosis with four stages, from an egg, to a crawling caterpillar, to a pupa, and then, a butterfly.
Q6. Study the table given below which shows the data on the hobbies of students during summer vacations. Write an analytical paragraph in about 120 words analyzing what hobbies do boys and girls choose in their summer vacations: [CBSE 2024]
| Hobbies | Boys | Girls |
| Singing | 7% | 25% |
| Photography | 35% | 5% |
| Playing | 30% | 16% |
| Dancing | 13% | 40% |
| Yoga | 19% | 15% |
Ans. The given table displays the data on the hobbies of students that they take up during the summer vacations.
There is a varied trend seen in students in relation to gender. It is seen that singing is the hobby that attracts boys the least whereas a small percentage of girls take up photography. In fact, photography is the one hobby that gets the most enthusiasm from boys but least enthusiasm from girls. The same goes for playing where the percentage of girls opting for it is only 16 percent while 30 percent boys opt for playing. On the neutral side, yoga is the hobby that gets almost the same amount of recognition from both genders – 19 percent from boys and 15 percent from girls. The least preferred hobby for girls is photography while for boys it is singing. In order to ensure a balanced growth, more involvement needs to be patronized in these fields.
Q7. An area is believed to be water stressed when annual water supplies drop below 1700 cubic metres per person per year. As per an analysis, we are already surviving with around 1700-1800 cubic metres per year. As our demand for water has increased drastically over the years, per capita water availability has taken a beating.
Based on the given table, write an analytical paragraph, in about 120 words, analyzing the possible causes of water scarcity in the future. [CBSE 2024]
Table on water availability
| Year | Population (Million) | Per capita water availability (m3/year) |
| 1951 | 361 | 5177 |
| 1955 | 395 | 4732 |
| 1991 | 846 | 2209 |
| 2001 | 1027 | 1820 |
| 2025 | 1394 | 1341 |
| 2050 | 1640 | 1140 |
Ans. The given table displays the data regarding per capita water availability in years ranging from 1951 to 2050. A side-by-side comparison of population and per capita water availability of each year is given for a better understanding of the impending water crisis.
In the year 1951, the population was 361 million, and per capita water was measured at 5177 m3/year. Since the minimum water requirement is 1700 m3/year, it clearly means that in 1951, there was abundant water for every person in the area. In 1955 as well, the per capita was 4732 m3/year for 395 million people each. However, by the year 1991, the population nearly doubled and the per capita water availability halved. Since then, the water availability has been dropping steadily. Gradually, in 2025, at population of 1394 million, the per capita water availability has dropped lower than the minimum requirement, meaning that this year marks the start of a water crisis. Moreover, it is predicted that till 2050, per capita water will be just 1140 m3/year.
The prediction is made with the trend of per capita water availability, which is steadily dropping due to unchanged, exploitative human activities and over-population. If appropriate measures to conserve water resources and to control population are not executed, then this prognosis will be our future.
Q8. There are many types of bottles available in the market. This chart compares the disadvantages and advantages of various types of bottles. Based on the chart, write an analytical paragraph, in about 120 words, analyzing the pros and cons of each and selecting a suitable one. [CBSE 2024]
| Chemical Free? | Environmentally Friendly? | Recyclable? | Durable? | Lightweight? | Easy to clean ? | Dishwasher safe? | Affordable? | |
| Glass Bottles | Yes | Yes | Yes | Yes | No | Yes | Yes | No |
| Silicone Bottles | Yes | Yes | Yes | Yes | – | Yes | Yes | No |
| Stainless Steel Bottles | Yes | Yes | Yes | Yes | No | Yes | Yes | No |
| Plastic Bottles | No | No | Yes | – | Yes | – | – | Yes |
(Adapted for academic purpose.)
Ans. The given chart displays information on different types of bottles available in the market.
There are four types of bottles – glass, silicone, stainless steel, and plastic. The first three criteria constitute the question of whether the bottles are environment-friendly or not. Out of the four, the type of bottle which is the least environment-friendly is plastic bottles. While the other three are chemical free and biodegradable, plastic is not. The one small pro of plastic bottles is that they are recyclable. Additionally, plastic bottles are more light-weight and affordable. Silicone bottles may not be as heavy as glass and stainless steel bottles or as light as plastic bottles.
In short, if you are looking for convenience, then plastic is the best option for you. However, if you are looking for a greener option, then choose either glass, stainless steel or silicone. If you want a mix of both, then silicone is the best option. Therefore, silicone bottles are the best type of bottles.
Q9. Read the following excerpt from a newspaper on the problem of car parking and its impact.
A survey conducted on the residents showed that car parking in colonies has risen due to an increase in the number of cars per family. This has resulted in ugly incidents of road rage. Most of the families revealed that they are facing multiple issues due to this situation. There is no place for visitors to park and residents themselves park their cars haphazardly. In addition there is an increase in commercial vehicles parked outside colony gates, thus blocking exits.
Write a paragraph in about 120 words to analyze the news clipping. [CBSE 2024]
Ans. The newspaper excerpt clearly highlights the serious problem that the outdated car parking system is facing. Due to a huge rise in cars per family, the old car parking system cannot accommodate all the cars in the colony car parking area, which means all the nearby roads and exit points are blocked by cars now.
The car parking arrangement must be improved upon to stop road rage incidents arising from this issue. This issue is causing unpleasantness within the members of society, as everyone keeps shouting at each other or ramming their car into another due to shortage of space. Soon, the situation might get out of hand and may even result in bigger and more tragic incidents. Fixing the car parking system is simply a cure, but we can prevent this situation by controlling family sizes or by opting for other modes of transport. Due to increasing families, everyone is buying huge, comfortable cars for their families. But we can consider other options like a bike or motorcycle, which is not only environment-friendly but also good for health. People who do not need to travel great distances, or if only a few people have to travel, even public transportation like buses and rickshaws are good alternatives.
Q10. The following data shows global literacy rates of different age groups and gender in a particular year. Write an analytical paragraph describing and analyzing the given data. [CBSE 2024]
| Global literacy rate % | People of different age-groups | |||
| 12-15 years | 15-24 years | 25-64 years | 65 years and older | |
| Men | 88 | 90 | 88 | 80 |
| Women | 80 | 88 | 79 | 75 |
Ans. The given table shows global literacy rates of different age groups and gender in a year. Four age groups are taken – 12 to 15 years, 15 to 24 years, 25 to 64 years, and 65 and older.
In all four age groups, men have more global literacy rate than women. The global literacy rate for men ranges from 80 to 90 whereas for women it ranges from 75 to 88. Both men and women have the highest rate in one age group – 15 to 24 years. The highest difference found in the age group 65 years and above, where men have a rate of 80 whereas women have a rate of only 75, a 15 rate difference. This difference can be easily explained by the fact that earlier, women’s education was not taken seriously and due to society’s gender norms, women were mostly encouraged to do household and familial tasks rather than leading an independent, self-reliant and career-oriented lives that most men lead.
Q11. A survey was conducted in New Delhi in over twenty schools about the different activities that interest the children in the age group of 13 to 15 years. Write an analytical paragraph in about 100 words analyzing the following information : [CBSE 2023]
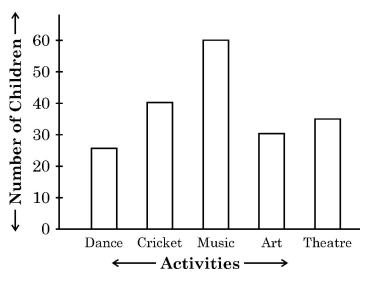
Ans. The given bar graph depicts the various activities children indulge in besides pursuing their academic goals. The graph shows the result of a survey which was conducted in over twenty schools in New Delhi to get a better understanding of what interests the new generation.
The children who were surveyed belonged to the age group 13 to 15 years old. Five activities in total were pointed out by the children – Dance, Cricket, Music, Art and Theatre. Out of these activities, music is the activity that fascinates the most number of children, with around 60 students preferring music as their passion. The activity with the least interest is Dance, which has half the number of students as Music. Art is also not as popular among the students as the others. Cricket and Theatre received an average amount of enthusiasm from the teenagers.
It shows that students have various hobbies to pursue. Other activities such as photography and cooking can also be introduced to students so that they can get the opportunity to widen their skill sets.
Q12. The chart below displays details regarding online activity for four age groups in six categories. Write an analytical paragraph for the table provided in about 100 words. [CBSE 2023]
| Activity% | Age | Age | Age | Age |
| Teens | 20s | 30s | 40s | |
| News | 76 | 71 | 72 | 78 |
| Downloads | 85 | 55 | 35 | 25 |
| Buying a product | 44 | 66 | 67 | 69 |
| Online games | 88 | 55 | 36 | 28 |
| Searching for a product | 0 | 77 | 81 | 85 |
| Searching for people | 6 | 33 | 22 | 21 |
Ans. The given chart shows the different types of online activities most people engage in on a daily basis.
The chart shows four age groups in six categories of online activity – news, download, buying a product, online games, searching for a product and searching for people. The four age groups are: teens, 20s, 30s, and 40s. According to the table of data, no teen uses the internet to search for a product online and very few teens search for people online. Teens use the internet to read news, download applications, movies and to play online games. People in their 20s use the internet to search for a product the most and an equal amount of these adults use the media to download or to play online games. People in their 40s use the internet to read news and to search for a product and use it the least to play online games or to download something for their work or entertainment.
Q13. It is distressing to see the attitude of people towards animals. The number of cases of cruelty towards animals is increasing. The following pie chart represents the attitude of people towards animals. Write an analytical paragraph in 100-120 words interpreting the data given in the pie chart. [CBSE 2023]
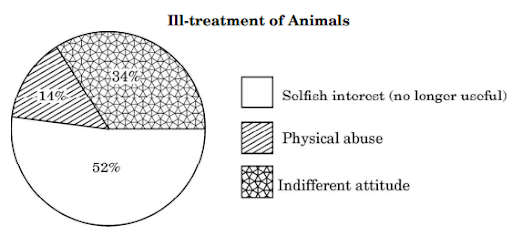
Ans. The number of cases of animal abuse is on a huge increase. The given pie chart represents the reasons behind this.
There are three main reasons: selfish interest, physical abuse, and indifferent attitude. The main and biggest reason is selfish interest. This means that most people only have pets when they are useful to them. But after a while, when the pet or animal has been fully exploited, they are cruelly treated. The smallest reason is physical abuse. Some people get satisfaction in harming animals. 34 % of the pie chart goes to indifferent attitude which means that people simply don’t care for animals and won’t stop other people from harming animals.
Q14. Study the bar chart given below. The chart depicts the number of students in Class Twelve opting for Humanities, Science and Commerce streams in urban and rural areas. Based on the details given in the bar chart given below, write an analytical paragraph in 100-120 words. [CBSE 2023]
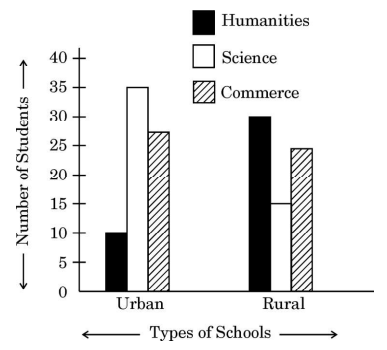
Ans. The given bar graph shows the number of students in their senior secondary classes opting for one of the three streams of subjects which are Arts or Humanities, Commerce and Science. Further, the graph aims to compare the preference of students in the urban and rural areas.
According to the graph, more students in urban areas tend to opt for Science stream, whereas in rural areas, Humanities is more prefered. In urban areas a mere 10 students opt for Humanities whereas 30 rural students opt for it. This contrast can be explained by the lack of scientific resources and immersion and encouragement in the rural areas. In rural areas, the schools do not have enough laboratory equipment for science subjects. The preference for Commerce is almost the same in both the areas, which is around 28 in urban and 25 in rural. Thus, there is a contrast in the number of students opting for Science and Humanities in urban and rural areas.
Q15. The given pie-chart shows how water is consumed in households in a metropolitan city in India. Study the information carefully and write a paragraph analysing the given pie-chart data. [CBSE 2023]
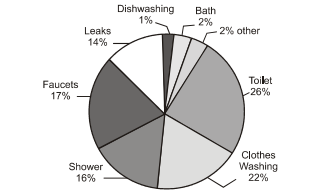
Ans. The given pie-chart shows the daily water consumption in households in a metropolitan city in India.
The majority of water is used in toilets at 26 percent and the least amount of water is used in dishwashing at 1 percent. If we compare a bath to a shower, a shower uses much more water that is 16%, about 14% more than a bath. Additionally, around 14% of water is wasted by leakage. Clothes washing is the second laergest consumer of water at 22%. Use of faucets takes up another 17% water everyday. Thus, we conclude that washrooms use more water than the kitchens.
Q16. The chart below gives the percentage of social media users by age in India in 2020. Write a paragraph analysing the given information in 100-120 words. [CBSE 2023]
Internet Activities by Age Group
| Age Group | |||||||
| Activity % | Teens | 20s | 30s | 40s | 50s | 60s | 70+ |
| Get News | 76 | 73 | 76 | 75 | 71 | 74 | 70 |
| Online games | 81 | 54 | 37 | 29 | 25 | 25 | 32 |
| Downloads | 52 | 46 | 27 | 15 | 13 | 8 | 6 |
| Product research | 0 | 79 | 80 | 83 | 79 | 74 | 70 |
| Buying a product | 43 | 68 | 69 | 68 | 67 | 65 | 41 |
| Searching for people | 5 | 31 | 23 | 23 | 24 | 29 | 27 |
Ans. The given data gives the percentage of various internet activities in different age groups in India. Except the teens, all other age groups indulge in a lot of online product research. Buying products online has a good percentage of people in the age group of 20s to 60s and there is a minor drop in teens and 70s age group. Getting news online is the most popular online activity in all age groups. The most popular activity among teens is online games and the least popular is product research. Downloading files from the internet sees a steady decline as we ascend the age groups with teens being the highest percentage of people downloading files and in age group of 70s being the least interested in it.
The data gives useful insights into the internet usage trends.
Q17. Internet provides every information one seeks at the click of a button. As a result children today are living in a comfort zone. According to research, this will result in long-term consequences which will affect their brain. Based on the following chart, write an analytical paragraph in not more than 120 words on activities to improve brain power : [CBSE 2022]
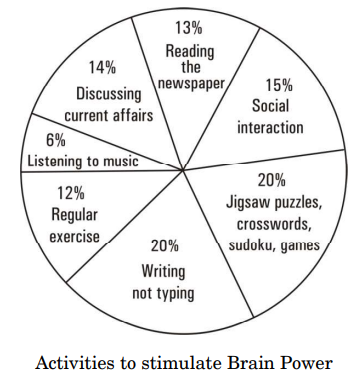
Ans. According to the pie chart, there are 7 activities which can help stimulate the brain while still providing excitement and a fun experience. Those activities are: reading newspaper, social interaxtopn, brain games like puzzles, sudoku, physical exercise, writing, music and discussing the current affairs. Out of these, brain games like jigsaw puzzles, crossword, Sudoku and writing, not typing provide the maximum brain stimulation at 20% each. The least brain power is provided by listening to music at 6 percent. We cannot overlook the benefits of social interaction which provides upto 15% stimulation to the brain. Close behind are discussions of current affairs at 14% and reading newspapers at 13%. Thus, using your brain for a variety of activities will help stimulate it and improve its power.
Q18. The chart given below shows loss of forest cover on account of development/commercial activities in Uttarakhand. Write an analytical paragraph in 100 120 words on the basis of the information given in the chart.
| Commercial activities | Loss of forest cover (in hectares) |
| Mining | 8,760 ha |
| Road construction | 7,539 ha |
| Power distribution lines | 2,332 ha |
| Hydropower plant projects | 2,295 ha |
| Other smaller activities (Railways, defence work, construction of buildings, etc.) | 20,998 ha |
Ans. The table gives data related to the various activities which cause loss of forest cover in Uttarakhand. The maximum loss of forest cover is caused by collective activities including railways, defence work, construction, etc. Mining alone accounts for a loss of 8,760 ha of forest cover. The loss of forest cover due to setting up of power distribution lines is approximately 25% of the loss cause by mining. Similarly, the loss caused by hydropower plants is also comparatively lesser at 2,295 ha. Road construction causes significant loss of forest cover at 7,539 ha. In total, an estimated 40,000 hectare of forest cover has been lost in Uttarakhand due to various development activities.
Q19. School authorities and parents have realized the benefits of encouraging their children to play and participate in sports. The age-old myth that academics is the only foundation for a successful career has been replaced. Write a paragraph in not more than 120 words analyzing the given information: [CBSE 2022]
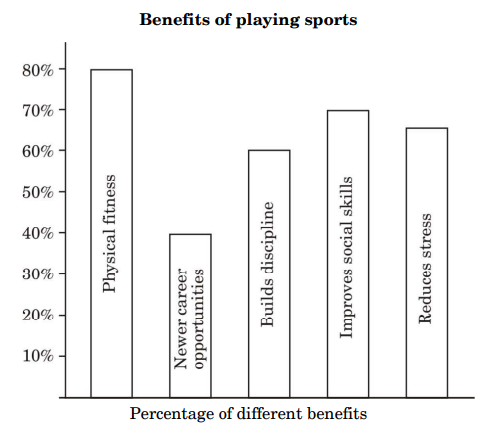
Ans. The given bar chart shows the percentage of benefits for students who opt for exercise.
Physical fitness tops the benefits at 80 percent. Only 40% students benefit from sports as providing newer career opportunities. Improvement in social skills and reduction in stress have an equal amount of benefit, since both are equally required in a student’s lifestyle.
Therefore, major reasons why students should play sports while also pursuing their goals in the academic world is to develop their body and mind properly, to develop social skills when they work in a team and to reduce stress that comes with meeting expectations and giving examinations.
Q20. A group of enterprising young adults conducted a survey on reopening of educational institutions in the National Capital [CBSE 2022]
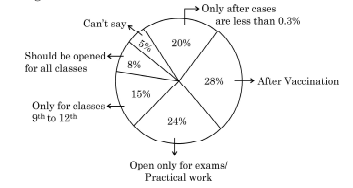
Write a paragraph in about 120 words analyzing the listed information:
Ans. A group of enterprising young adults conducted a survey on reopening of educational institutions in the National Capital during the covid pandemic. The given pie chart constitutes a range of opinions belonging to the students studying in the institutions on the matter.
Majority of the students, which is about 28 percent, say the institutions should reopen after the vaccination. Many students, around 24 percent, are of the opinion that the institutions should reopen only for examinations and/or practical work. A minority, which is only 5 percent are not sure when the schools should reopen. Only 8 percent of students have expressed the opinion that the schools should be reopened for all classes. However, most of the students suggest that schools should go back to normal functioning only when the pandemic and number of cases settle down more. Keeping in mind that vaccination is still in progress and the number of cases is still the same, the pandemic is still at a dangerous stage and the youth of the nation cannot be put at risk.
Conclusion
This post helps students of class 10 to understand and see the previous year questions on Analytical paragraph writing. The topic is tough and internal choice can be availed to write any one paragraph as per the student’s ability.